Analysis of single MD
Job name: Zajecia 9 - 3x
Downloading trajectory... Please wait.
Loading...
Flareplot frames range 1-1 / 100
Charts:
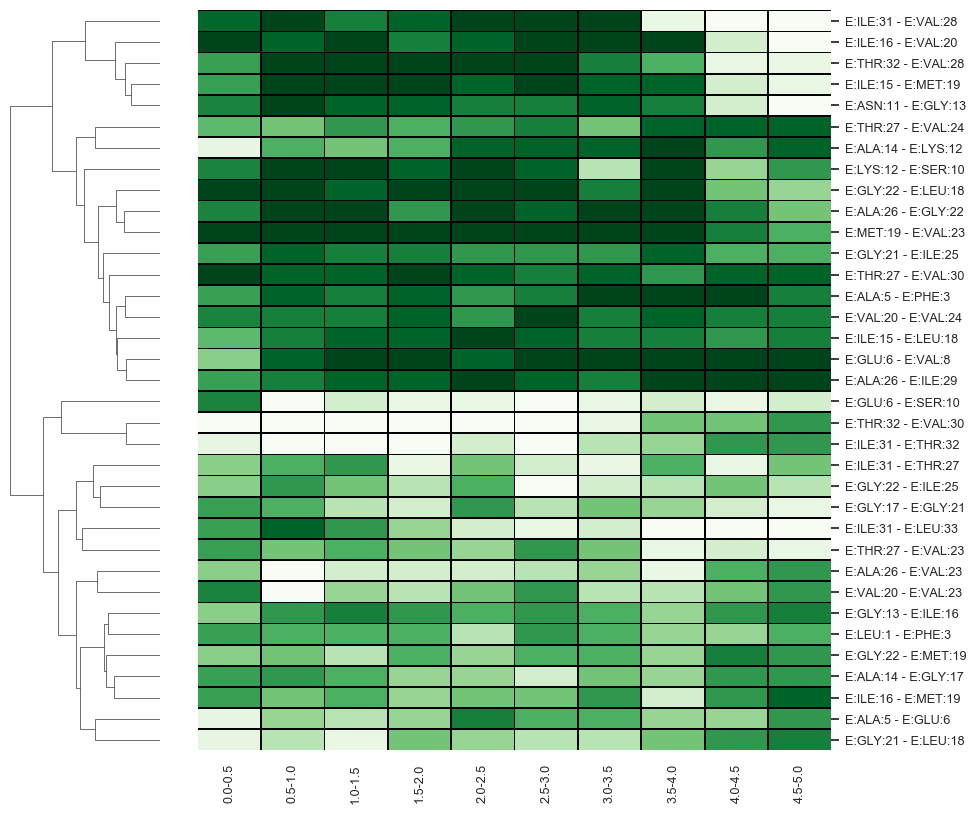
Heatmap of unfolding of substrate (chain E) during simulation.
Color denotes a probability of presence of a hydrogen bond in subsequent parts of the simulation.
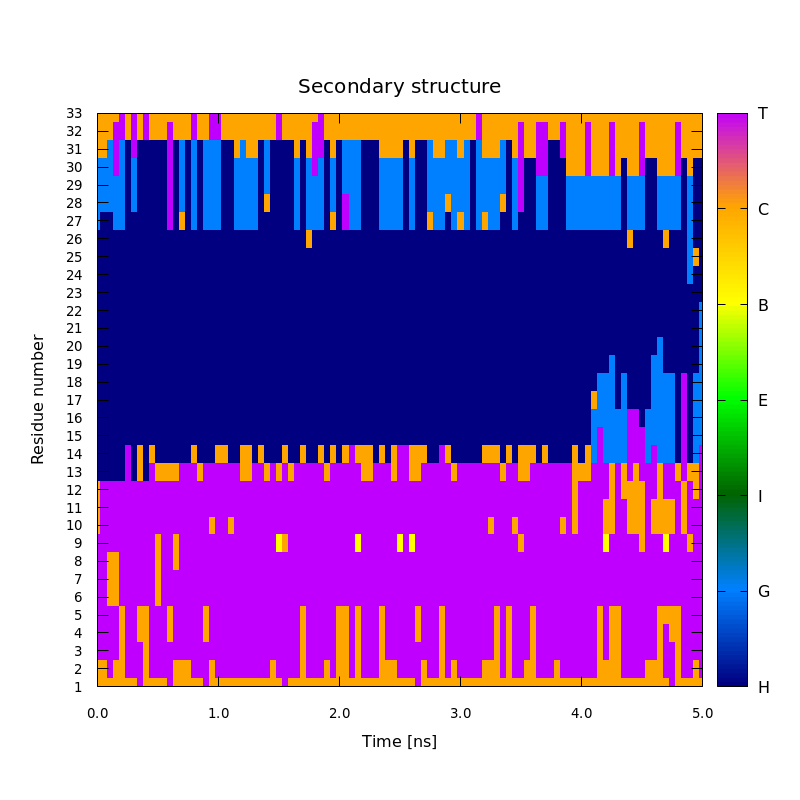
H - α-Helix, G - 310-Helix, I - π-Helix, E - Strand, B - Bridge, C - Coil, T - Turn.
Job info
GS Mode: membrane
Peptide substrate: A4_HUMAN
Trimmed sequence: LVFFAEDVGSNKGAIIGLMVGGVVIATVIVITL
Substrate length [aa]: 33
Total length [ns]: 5
Membrane thickness [Å]: 31.0
SMD chain and residues: E 33
SMD velocity [m/s]: 0.3
SMD k [kcal/mol/Å2]: 1.0
SMD (x y z) [Å]: (-3.76 -0.096 -8.898)
Mutations: BE280A, BG384A, BA434C
Continue mode
Selected frame:
Please select a frame 1 to 100 which will be the entry point for new simulation.